A few years back, I spearheaded an initiative with my previous company to provide dashboard visualizations for market research studies – think A/B testing. Originally, this dashboard was created in PowerBI; albeit a powerful visualization tool, PowerBI required consistent creation of the dashboard for every new market research study and was not easily shared with our clients (required clients to also have PowerBI). PowerBI is right for many scenarios but unfortunately not for this one.
After reviewing other visualization tools, I stumbled across an application called Plotly. Plotly is an open source software that lets you “build and deploy analytic web apps using Python.” More importantly, we were able to deploy out minimum viable product with relatively little code required.
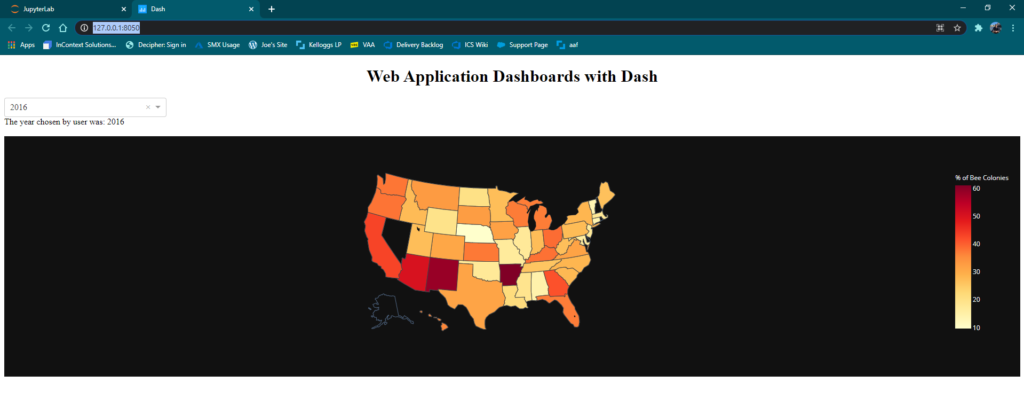
Plotly was perfect for our situation – it was cheap, low barrier to entry, could be automated, and was easy for our clients to access (Plotly visualizations were shared with a web link). Before introducing this to the larger analytics group, I wanted to play around with it myself to better understand what we were working with. If you are interested in getting a basic understanding of the baseline visualization and analysis of what Plotly can provide, feel free to follow along with me. I will narrate both my experience and the instructions to create our output. We will create the visualization shown below, which allows you to analyze bee colonies by state and year. Most importantly, you can begin to understand what Plotly can do for you.
First and foremost, I simply looked up ‘how to start with Plotly,’ which led me to this great video by Charming Data. I would highly suggest checking it out to get started. If you are new like me, it might take a bit of time to pick up, but for intermediate to expert programmers it should be very straightforward.
In this video, Charming Data uses Pycharm as his IDE – I, however, really love the UI of Jupyter, so I wanted to be able to code in that. That led me to this video, also by Charming Data (thanks Charming Data – love your stuff). This video was really helpful for a couple of key reasons:
- It installs some really good packages on your computer that will be super useful down the road. Examples include numpy, pandas, and of course, plotly. It will also install JupyterLab.
- Second, it teaches you how to set up an environment, which its importance is explained here.
- It actually walks you through importing a simple graph and displaying it in JupyterLab
- Most importantly in my mind, it walks you through documentation and how to look up troubleshooting / code / other packages (troubleshooting and learning on the go is what it’s all about)
After this was set up, I went back to the original video, in which it explained how to make a simple yet unique graph. To be honest, I pretty much copied the code exactly, but I had to trouble shoot along the way. Copying and modifying code is never bad (we all get inspiration from somewhere) but it is IMPERATIVE you understand what you are copying. Otherwise, it’s both in bad taste and plagiarism.
- In Charming Data’s code, he uses pycharm, and I was in JupyterNotebook. Ultimately, my code did not run as intended until I made a slight modification, which can be outlined here. It comes down to changing his code of dash.Dash to jupyter_dash.JupyterDash.
- I would highly suggest copying this code snippet, which is a combination of what Charming Data uses with the slight modifications included in the medium article that adjust to what we need. From there, continue on copying and pasting with the rest of the code. Please utilize the video resources to understand what is being copied.
import pandas as pd
import plotly.express as px # (version 4.7.0)
from jupyter_dash import JupyterDash #additional needed line
import plotly.graph_objects as go
import dash # (version 1.12.0) pip install dash
import dash_core_components as dcc
import dash_html_components as html
from dash.dependencies import Input, Output
app = JupyterDash(__name__)#additional line needed
If you run into other errors at this point, they should be relatively simple and nothing the internet wouldn’t be able to solve.
After modifying the code (slightly) to work with JupyterLab, I simply copy and pasted everything else, and out came this great new visualization. I really love the FigureWidget option, which is a simple line or two of code that let’s you view your visualization right in your browser – at any time, I can highlight code, run it, and see how it affects my output. For this reason, I will continue to work with FigureWidget and JupyterLab for my Dash learning moving forward.
Although I didn’t sit down and write lines of code, I learned a lot through this process:
- I learned to set up an env
- I learned the fundamentals of a plotly graph – Dash Components (Checkbox, dropdown, interactive capabilities), Plotly Graphs (Scatter plot, bar chart, etc…best utilized by plotly.express), and the callback (connecting the Dash components and Plotly graphs to create interaction) & how they are structured in the code. The components and Graphs are inside the app layout, whereas the callback is outside it.
- Understanding this, like Charming Data says, I feel confident in my ability to analyze all Dash code where I can hopefully modify to my needs.
- Most importantly, I learned how to troubleshoot along the way. Although I didn’t sit down and code, I learned a lot. I had to use a lot of different resources to even copy and paste this simple code snippet, but the more I struggled, the more I began to understand just by reading and watching online resources.
Take time to sit down and really understand when you are troubleshooting – of course it takes time, but that is time well spent. The best thing about python learning has been that (nearly) everything can be found online, and to me, that is critical. Start to love stack overflow. If the answer is online, no matter how long or short, I can sit down and figure it out. Not only has that helped me in my Python learning, but it has helped me in life as well. If you don’t know the answer, take time to search for all resources that could help, and truly focus on understanding what those resources offer. You’ll be better off for it.